Dane Wigington
The spraying of Earth’s atmosphere with toxic metallic nano particles and unknown other chemicals is getting worse by the day. There is absolutely no plausible denial of this as we have film footage of US military jets, like KC 10 tankers, spraying at altitude.
Even though the skies around much of the globe already look like something from another planet, amazingly many people still have not noticed as they never seem to look up. The power structure had made sure the population has so many distractions that the can not seem to see the dots let alone connect them.
The planet is in meltdown and climate engineering is fueling the fire. Nearly the entire climate science community is blatantly lying by their total omission of the geoengineering elephant in the room, much of this lying is in the form of simple denial. Unfortunately, much of the anti-geoengineering community is has also gone off course by not recognizing the fact that our climate is in meltdown. Though there are many causes of the climate unravelling (geoengineering being a primary factor), at minimum, those who are aware of climate engineering should at least consider the overall warming effect of the atmospheric spraying programs. This is not about Al Gore, its about the reality on the ground.
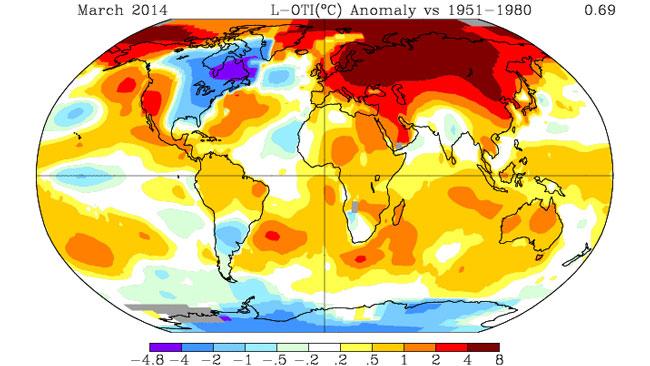
The global temperature map in the article below should be a stark wake up call to all. The only places that have below normal temperatures based on 30 year averages are the eastern half of the North American continent and a few places in Antarctica, the rest o of the planet is in meltdown. Though we know government agencies lie about everything, here is the paradox in this case. The “official” temperatures (on which maps like the ones below are based) are being falsified to the DOWN side, not the UP side. We are seeing “official high temperatures” for any given day routinely falsified to the DOWN side by up to 5 degrees. What does this mean? The planet is even hotter than this map shows. If you don’t believe this, you will soon. Global climate engineering is making an already bad situation EXPONENTIALLY WORSE, a runaway “greenhouse” effect is already under way.
DW
March 2014 Among Hottest on Record, NASA Data Show
Last month was the fourth-warmest March since modern historical temperature records began in 1880, according to data provided by NASA’s Goddard Institute for Space Studies.
The global mean temperature for March 2014 was about 0.7°C (about 1.26°F) higher than the 1951-1980 average, placing it fourth in line behind 2002, 2010 and 1990 among the hottest Marches on record.
Powering last March’s near-record global temperatures was a “sea” of extraordinary warmth (shown in the map above, in dark and bright red colors) that stretched across much of Eastern Europe and Russia all the way to the western United States, noted weather.com meteorologist Jon Erdman.
“March was indeed cold in the eastern United States, much of Canada and parts of southern South America,” he said. “However, the broader picture showed a sea of warm anomalies from Europe across Russia to Alaska and the western United States.”
Wildfires burned across a large swath of Siberia in early April, Weather Underground’s Christopher Burt pointed out, adding that the southern Siberian city of Chemal soared to a high temperature of 83.7°F on April 2, at least 40 degrees above its average high for the day.
As the NASA-GISS graph below shows, the March temperature anomaly last month was starkest at Earth’s highest latitudes:

It’s worth noting that monthly temperature rankings can change and so records like these should be viewed with caution, NASA climatologist Gavin Schmidt said in an email conversation with weather.com.
The difference between the top six March values are small enough, he pointed out that small differences or new information – such as a different analysis method by NOAA or the U.K.-based Hadley Centre – can change the rankings significantly. That can move a third-place ranking down to a sixth-place ranking or vice-versa, he added.
NOAA, the Hadley Centre and NASA-GISS maintain the world’s three most widely-cited historical temperature databases, all of which feature records that date back to the late 1800s.


Geoengineering, in the name of preventing global warming, is causing it, due to these artificial clouds holding in more heat than they are supposed to be repelling. They then blame it on us and our automobiles and “carbon footprints, cow flatualence, etc, when it is they who are purposely causing the problem. They will have global warming, come hell or hight water, and make much political hay out of it and destoy many, in the process. May they be stopped, Lord Jesus. In Revelation, it says Jesus, when He returns, “will destroy those who destroy the earth”; so be it. Maranatha, even so, come Lord Jesus!